SIP Returns in India: How They Are Calculated and What Investors Should Realistically Expect
Systematic Investment Plans have emerged as one of the most democratised investment vehicles in India over the past decade, drawing millions of retail investors into equity and debt markets through disciplined, periodic contributions. Yet despite their widespread adoption — with AMFI data consistently reporting monthly SIP inflows crossing ₹20,000 crore — a surprisingly large proportion of investors remain unclear about how SIP returns India how calculated actually works in practice. Understanding the mechanics behind SIP return computation is not merely academic; it directly influences how investors interpret their portfolio statements, compare funds, and make informed decisions during periods of market turbulence. This guide breaks down the mathematics, the metrics, the risks, and the historical benchmarks that every serious mutual fund investor in India should know.
What Is a SIP and How Does Rupee Cost Averaging Affect Returns?
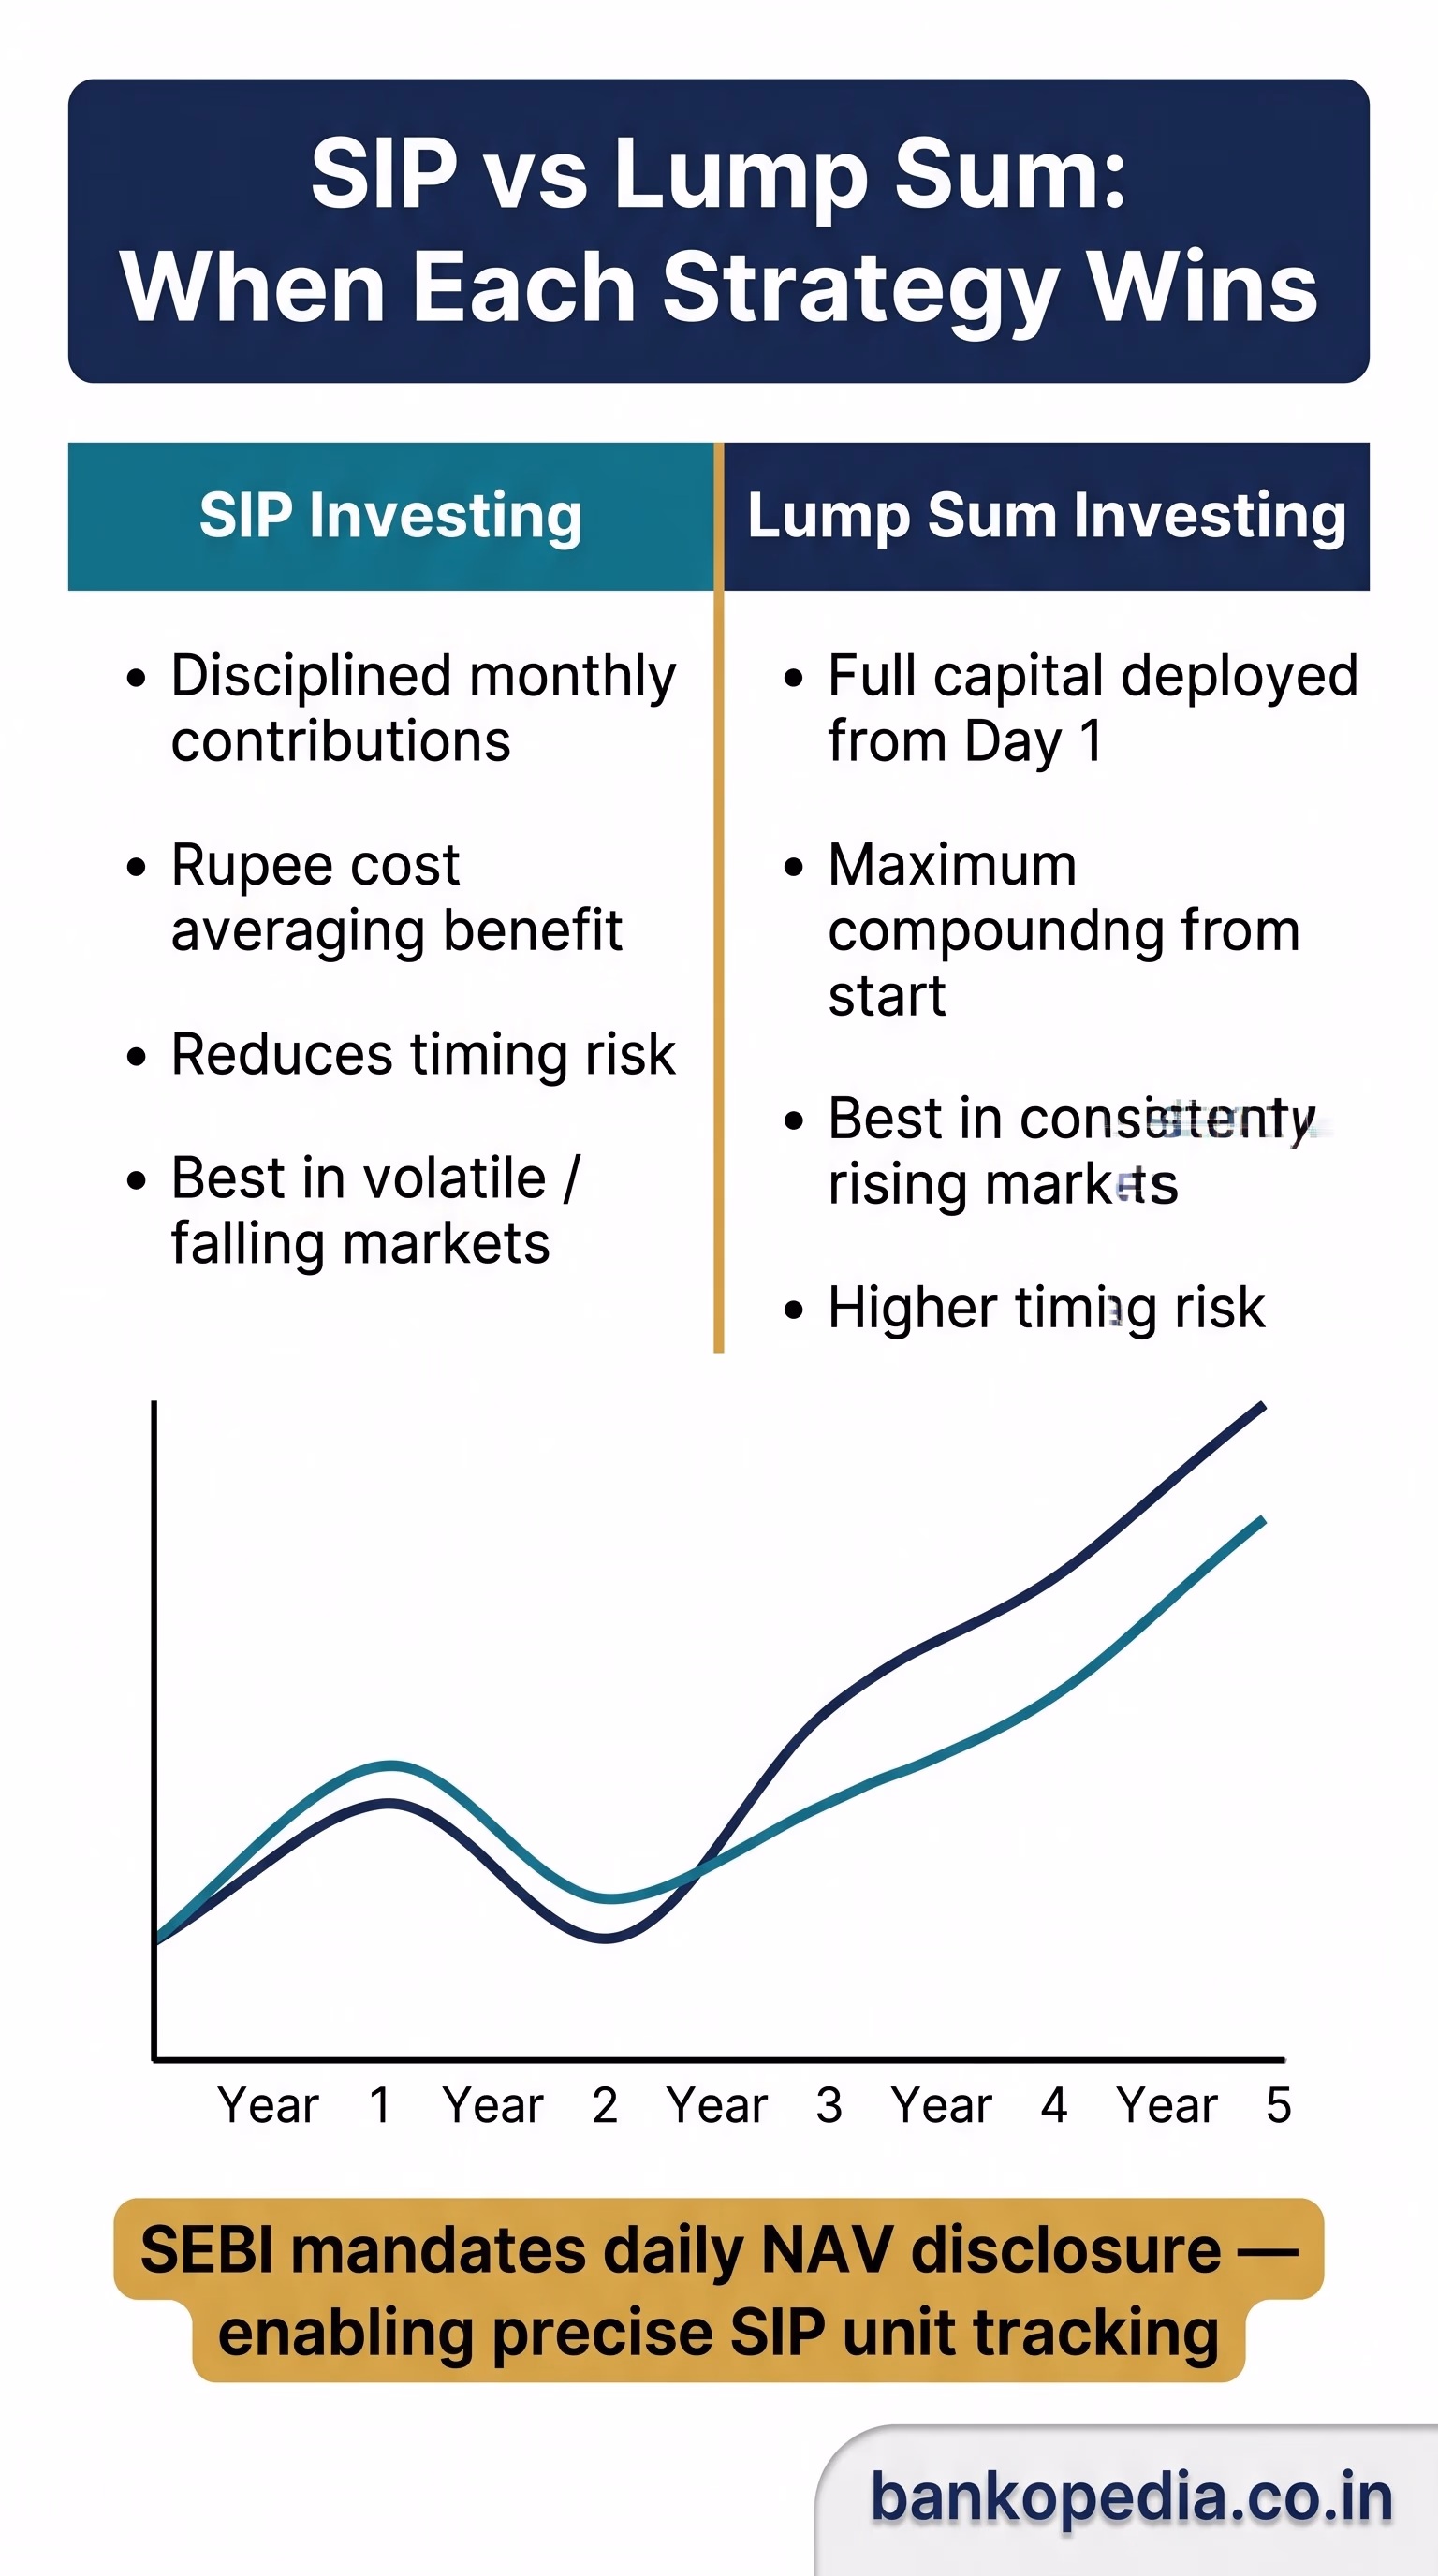
A Systematic Investment Plan is a mode of investing a fixed amount at regular intervals — typically monthly — into a mutual fund scheme. Unlike a lump-sum investment where you deploy capital at a single net asset value (NAV), a SIP purchases units across multiple NAV points over time. This structural difference is at the heart of a concept called rupee cost averaging, which is frequently cited as one of the primary advantages of SIP investing.
Rupee cost averaging works on a straightforward principle: when markets fall and NAVs are lower, your fixed monthly contribution buys more units; when markets rise and NAVs are higher, the same contribution buys fewer units. Over a sufficiently long investment horizon, this averaging effect reduces the average cost per unit compared to what a poorly timed lump-sum investor might have paid. However, it is important to dispel a common misconception — rupee cost averaging does not guarantee superior returns over lump-sum investments in all scenarios. In consistently rising markets, a lump-sum deployed at the start would outperform a staggered SIP because capital is fully invested from day one.
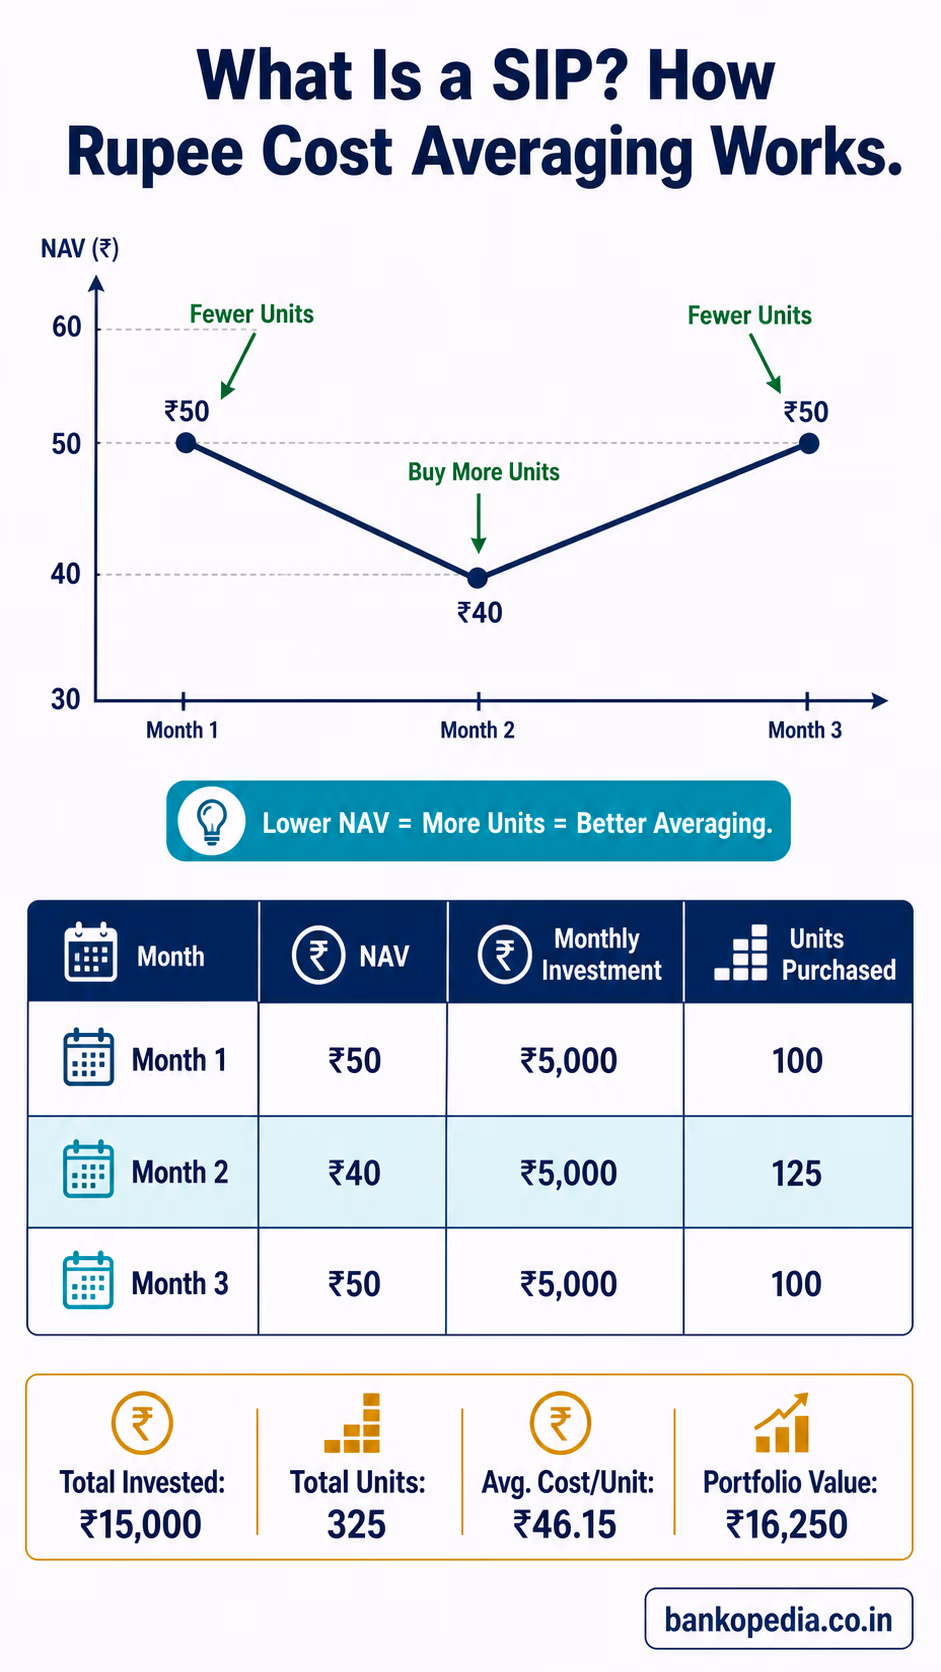
Consider a simplified example. An investor contributes ₹5,000 per month into an equity fund over three months with NAVs of ₹50, ₹40, and ₹50 respectively.
Month 1: ₹5,000 ÷ ₹50 = 100 units
Month 2: ₹5,000 ÷ ₹40 = 125 units
Month 3: ₹5,000 ÷ ₹50 = 100 units
Total investment: ₹15,000. Total units accumulated: 325. Average cost per unit: ₹46.15, even though the NAV started and ended at ₹50. The investor has effectively built a buffer through the dip, and at the final NAV of ₹50, the portfolio is worth ₹16,250 — a gain despite the market having gone nowhere net-net over the period.
SEBI's regulatory framework mandates that mutual funds disclose NAV on every business day, which provides the granular data necessary for this unit-based calculation. The discipline of SIP investing also removes the behavioural risk of market timing — a significant source of value destruction for retail investors who tend to invest during euphoria and withdraw during panic.
XIRR vs Absolute Returns: Which Metric Should SIP Investors Use?
One of the most critical — and most misunderstood — aspects of evaluating SIP returns in India and how they are calculated relates to which return metric is actually appropriate. Most investor-facing platforms and fund factsheets display returns in terms of CAGR (Compounded Annual Growth Rate), but this figure, while valid for lump-sum investments, is misleading when applied to SIPs where cash flows occur at multiple points in time.
Why Absolute Returns Alone Are Insufficient
Absolute return simply measures the percentage gain on invested capital without accounting for the time value of money or the timing of individual investments. If you have invested ₹1,20,000 over 24 monthly SIPs of ₹5,000 and your portfolio is now worth ₹1,50,000, the absolute return is 25%. But this number tells you nothing about how efficiently that gain was generated relative to time, nor does it allow meaningful comparison with a fixed deposit or another SIP investment of different duration.
Understanding XIRR: The Correct Tool for SIP Evaluation
XIRR — Extended Internal Rate of Return — is the standard metric endorsed by financial planners and SEBI-registered investment advisers for evaluating SIP performance. It accounts for the specific dates and amounts of each cash flow (i.e., each monthly SIP instalment) and computes an annualised return that is equivalent to what a single lump-sum investment would have needed to earn to match the same outcome.
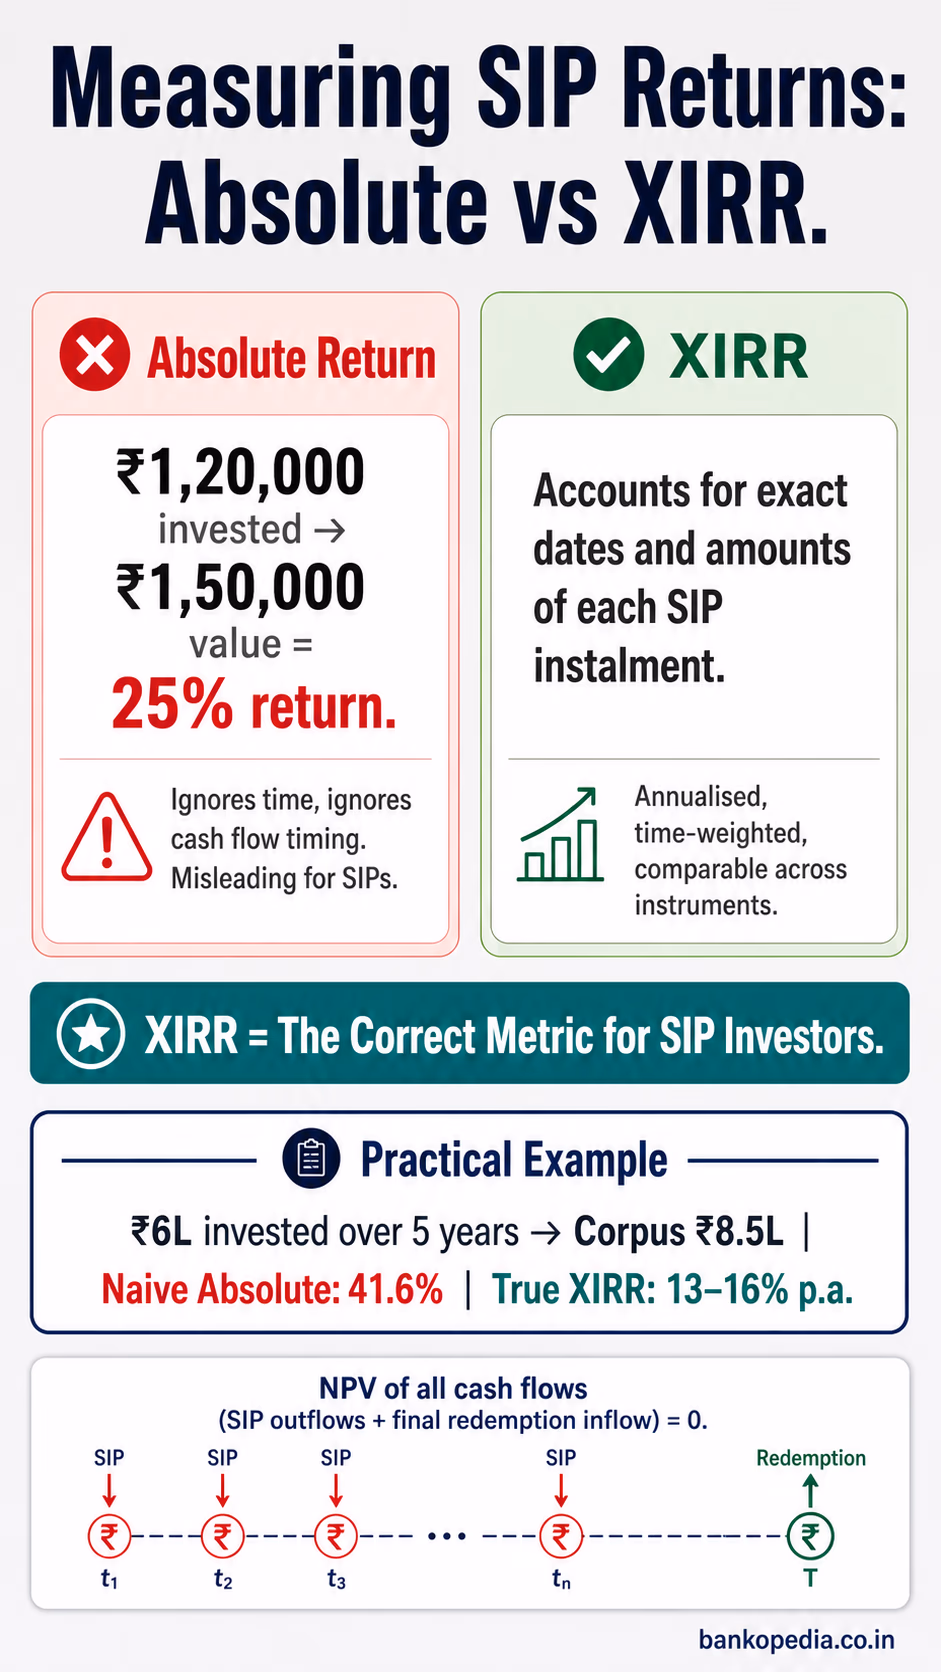
XIRR is essentially the annualised yield that equates all your invested cash flows, properly time-weighted, to the final portfolio value. It is the most accurate representation of the real return your SIP has delivered.
The mathematical formula underlying XIRR solves for the rate r in the equation where the net present value of all cash flows — both outflows (your monthly investments) and the final inflow (redemption value) — equals zero. In practical terms, this calculation is available in Microsoft Excel, Google Sheets, and most mutual fund portfolio tracking platforms. AMFI-registered distributors are increasingly trained to present XIRR figures to clients rather than simple CAGR.
A Practical Comparison
An investor who started a ₹10,000 monthly SIP in a large-cap fund five years ago and accumulated a corpus of ₹8.5 lakh against an invested amount of ₹6 lakh might see an absolute return of approximately 41.6%. The CAGR on the total invested amount might appear modest when computed naively. However, the XIRR for this investor — accounting for the fact that the first instalment was invested for the full 60 months but the last instalment was invested for only one month — would likely reflect a figure in the range of 13–16% per annum depending on the fund and market cycle. This is the number that meaningfully benchmarks against other instruments.
Why SIP Returns Fall During Market Volatility and Bear Phases
Recent market conditions have served as a timely reminder that SIPs are not insulated from equity market risk. The headline "After flying high, turbulence hits SIP returns" has resonated with millions of Indian investors who enrolled in SIPs during the bull run of 2021–2023, only to see their XIRR compress sharply as broader indices corrected. Understanding why this happens — and why it is structurally expected — is fundamental to maintaining investment discipline.
The Sequence of Returns Problem
For a SIP investor, the sequence in which returns occur matters enormously. A bear phase early in the SIP journey is actually mathematically beneficial — it allows more units to be accumulated at lower prices, setting up strong recovery gains. However, a sharp market correction that occurs late in the SIP tenure, just before or after accumulation ends, can significantly dent the corpus because a large quantity of units (built over years) experiences a uniform value decline.
This is precisely what investors in mid-cap and small-cap oriented SIPs experienced during periodic corrections in 2018, 2020, and again during select phases of 2024. Those who had been investing since 2017 and planned to redeem in 2020 found their XIRR sharply negative, not because the SIP mechanism failed, but because the timing of withdrawal coincided with peak market stress.
Sectoral Concentration and Fund Manager Risk
Beyond broad market cycles, SIP returns in specific schemes can diverge significantly from benchmark indices due to fund manager allocation decisions, sectoral bets, and portfolio concentration. SEBI's categorisation and rationalisation circular of 2017 brought greater definitional clarity to fund categories — distinguishing large-cap, mid-cap, small-cap, flexi-cap, and thematic funds — but within each category, active management introduces additional dispersion of returns.
Inflation and Real Returns
An often-overlooked dimension of SIP return analysis in India is the erosion of purchasing power. With India's retail inflation (as tracked by the Consumer Price Index and monitored by the RBI's Monetary Policy Committee) averaging 4–6% in recent years, a nominal XIRR of 10% translates into a real return of approximately 4–6%. Investors benchmarking SIP returns against fixed deposits or small savings schemes (which are reset periodically by the Ministry of Finance based on G-Sec yields) must account for this inflation differential in their assessments.
Behavioural Pitfalls During Downturns
Data from AMFI consistently shows elevated SIP discontinuation rates during periods of sustained market weakness. Investors who pause or cancel SIPs during bear phases effectively lock in their losses and miss the recovery-phase unit accumulation that is the cornerstone of rupee cost averaging. Financial advisers and SEBI-registered investment advisers repeatedly emphasise that SIP discontinuation during downturns is the single largest destroyer of long-term wealth for retail mutual fund investors in India.
Historical SIP Return Benchmarks Across Equity, Debt and Hybrid Funds in India
Establishing realistic return expectations requires examining long-term historical data across fund categories. The following benchmarks are based on rolling SIP return analyses and publicly available AMFI data, and are intended to provide directional guidance rather than guaranteed projections.
Equity Funds
Equity mutual funds have historically delivered the highest long-term SIP returns in India, but with proportionately higher volatility. Broad benchmarks, based on 10-year rolling SIP XIRR data, suggest the following:
Large-cap funds: Typically delivered XIRR in the range of 10–14% per annum over 10-year SIP horizons, broadly tracking Nifty 50 and Sensex performance.
Mid-cap funds: Historical XIRR ranging from 12–18% over 10-year periods, reflecting the higher growth potential of mid-sized companies alongside greater drawdown risk.
Small-cap funds: The most volatile category, with 10-year SIP XIRR ranging from as low as 8% to as high as 22% depending on entry period — underscoring the importance of investment horizon and timing of analysis.
ELSS (Equity Linked Savings Schemes): Popular for their Section 80C tax benefits under the Income Tax Act, ELSS funds have delivered returns broadly comparable to large and flexi-cap funds, typically 11–15% XIRR over long horizons.
Debt Funds
Debt mutual fund SIPs are less commonly discussed but serve an important role in portfolio construction, particularly for investors approaching financial goals or seeking capital preservation. The RBI's monetary policy cycle significantly influences debt fund returns:
Liquid and overnight funds: Returns largely track the RBI's repo rate corridor, historically delivering 4–7% annualised, suitable for short-term parking of capital.
Short-duration and corporate bond funds: Historically delivered 6–8% XIRR over 3–5 year SIP horizons.
Dynamic bond and gilt funds: Returns are highly sensitive to interest rate movements; investors in these categories have seen XIRR ranging from 5% to 11% depending on the rate cycle phase in which they were invested.
It is worth noting that SEBI's revisions to debt fund taxation in 2023 removed the indexation benefit for debt mutual funds, making their post-tax returns more comparable to fixed deposits for many investors. This regulatory change has had a material impact on the attractiveness of SIPs in debt categories for certain investor profiles.
Hybrid Funds
Hybrid funds — including balanced advantage funds (BAFs), aggressive hybrid funds, and multi-asset allocation funds — occupy the middle ground and are increasingly recommended by financial planners for first-time equity investors:
Aggressive hybrid funds: With 65–80% equity allocation, these have delivered 10–13% XIRR over 7–10 year SIP periods historically.
Balanced advantage / dynamic asset allocation funds: These funds dynamically shift between equity and debt based on valuation models; historical SIP XIRR of 9–12% with lower drawdowns compared to pure equity.
Conservative hybrid funds: Predominantly debt with limited equity exposure; SIP XIRR of 7–9% historically, appealing to risk-averse investors seeking marginal equity upside.
A Note on Benchmark Comparison
SEBI mandates that all mutual fund schemes disclose performance against a designated benchmark index and a TRI (Total Returns Index) benchmark, which includes dividend reinvestment. Investors evaluating SIP performance should compare their XIRR against the corresponding TRI benchmark, not just the price-return index, to accurately assess whether active fund management is adding value net of expense ratios.
Practical Takeaways for SIP Investors in India
The landscape of SIP investing in India is simultaneously simpler and more nuanced than most retail investors appreciate. Several practical principles emerge from a rigorous analysis of how SIP returns are calculated, the appropriate metrics for measurement, and the forces that drive return volatility:
Use XIRR, not absolute returns or naive CAGR, when evaluating your SIP portfolio. Most major platforms — Zerodha Coin, Groww, MFCentral — now provide XIRR-based reporting.
Match your fund category to your investment horizon. Equity SIPs require a minimum 5–7 year horizon to meaningfully smooth out market volatility; debt SIPs are appropriate for 1–3 year goals.
Do not discontinue SIPs during market downturns unless facing genuine liquidity distress. The mathematics of rupee cost averaging works in your favour precisely during periods of depressed NAVs.
Review, do not react. Annual portfolio reviews aligned with your financial goals — conducted ideally with a SEBI-registered investment adviser — are more productive than month-to-month performance monitoring.
Account for taxation in your return expectations. Equity fund LTCG above ₹1.25 lakh is now taxed at 12.5% (post the Union Budget 2024 revision), and STCG is taxed at 20%. Debt fund gains are taxed as per your income slab. Net-of-tax XIRR is the figure that matters for actual wealth creation.
SIP investing remains one of the most accessible and structurally sound methods for long-term wealth creation available to Indian investors. But its effectiveness depends critically on investor understanding — of how returns are built, how they are properly measured, and what market dynamics can temporarily erode them. Armed with that understanding, the systematic investor is far better positioned to stay the course through inevitable periods of turbulence and capture the compounding benefits that patient, disciplined participation in Indian capital markets has historically rewarded.